
Featured Projects
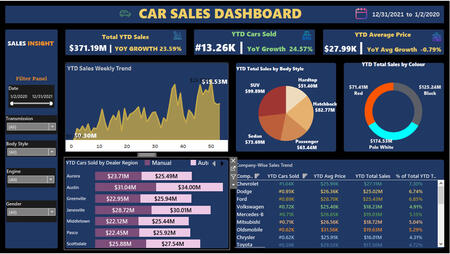
SQL | TABLEAU CAR SALES ANALYSIS DASHBOARD
Replaced a manual process by calculating fields in Tableau and developing a Tableau dashboard to analyze car sales for data-driven decision-making and portfolio management.
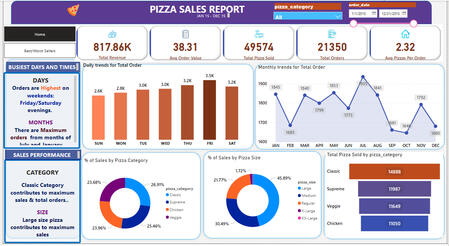
SQL | POWER BI PIZZA SALES ANALYSIS
Used SQL queries to extract data for analysis in Power BI and developed a Power BI dashboard to analyze pizza sales for data-driven decision-making and business optimization.
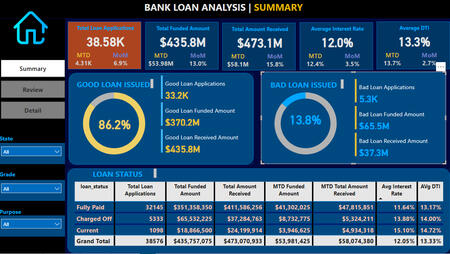
SQL | POWER BI BANK LOAN ANALYSIS DASHBOARD (SUMMARY PAGE)
Created an SQL script that extracted respective data based on the KPI:s and prepared a Power BI dashboard to analyze loan performance by 'Loan Status,' tracking key metrics for data-driven decision-making and portfolio management.
SQL | POWER BI BANK LOAN ANALYSIS DASHBOARD (REVIEW PAGE)
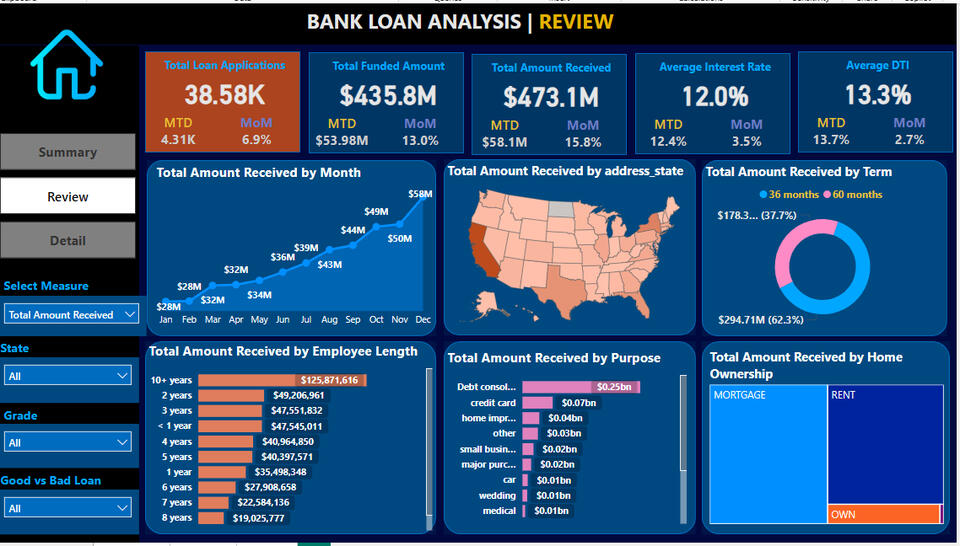
Key Takeaways from the Bank Loan Analysis Dashboard
Loan Growth & Trends
38.58K total applications, with 4.31K MTD (6.9% MoM growth).
Increasing loan demand indicates strong market interest.
Loan Funding & Repayment
$435.8M funded, with $53.98M MTD (13.0% MoM growth).
$473.1M received, exceeding funded amounts (positive cash flow).
Interest Rates & Borrower Risk
12.0% average interest rate, rising 3.5% MoM.
13.3% DTI, up 2.7% MoM, signaling a higher debt burden.
Good vs. Bad Loans
Good Loans: 86.2%, with $370.2M funded, $435.8M received.
Bad Loans: 13.8%, with $65.5M funded, only $37.3M received (default risk).
Loan Status Breakdown
Fully Paid: $351.36M funded, $411.59M received.
Charged-Off (Defaults): $65.53M funded, $37.28M recovered (loss risk).
Current Loans: $18.87M funded, $24.19M received.
Insights & Recommendations
Strong loan demand and repayments signal positive growth.
Rising DTI & bad loans (13.8%) need risk control measures.
Strengthen loan recovery & risk-based pricing for profitability.
SQL | POWER BI PIZZA SALES ANALYSIS (BEST AND WORST SELLERS PAGE)
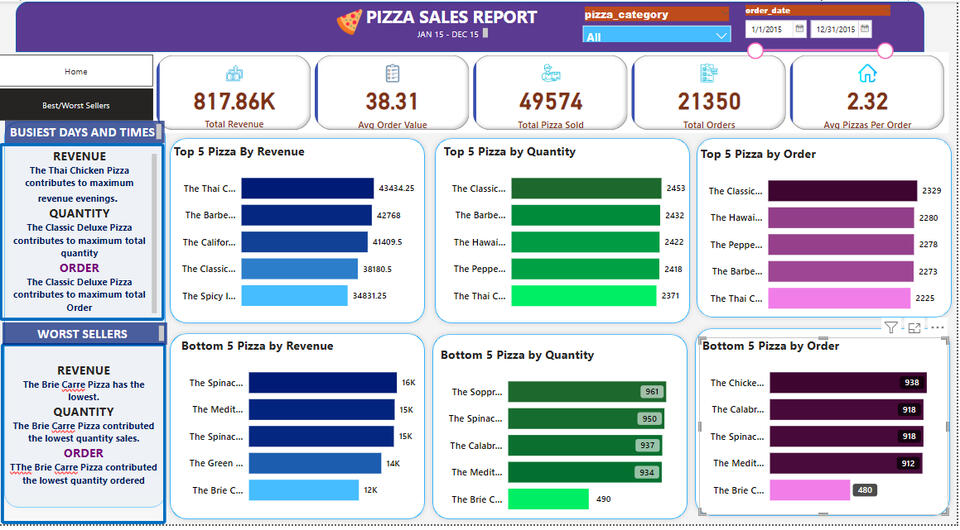
Key Takeaways from Pizza Sales Report
Strong Sales Performance
Revenue: $817.86K | Orders: 21,350 | Pizzas Sold: 49,574
Avg Order Value: $38.31 | Avg Pizzas per Order: 2.32
Top-Selling Pizzas
Revenue: Thai Chicken Pizza leads ($43.43K).
Quantity & Orders: Classic Deluxe Pizza ranks highest (~2,450 units/orders).
Worst-Selling Pizzas
Brie Carre Pizza has the lowest revenue ($12K), sales (490), and orders (480).
Peak Sales Insights
Thai Chicken Pizza drives evening revenue.
Classic Deluxe Pizza dominates in quantity and orders.
Recommendations
Promote top-sellers (Thai Chicken, Classic Deluxe).
Reduce waste & optimize low-sellers (Brie Carre, Mediterranean).
Use targeted marketing & bundling for underperformers.
EXCEL INTERACTIVE DASHBOARD SPAR SUPERMARKET SALES ANALYSIS
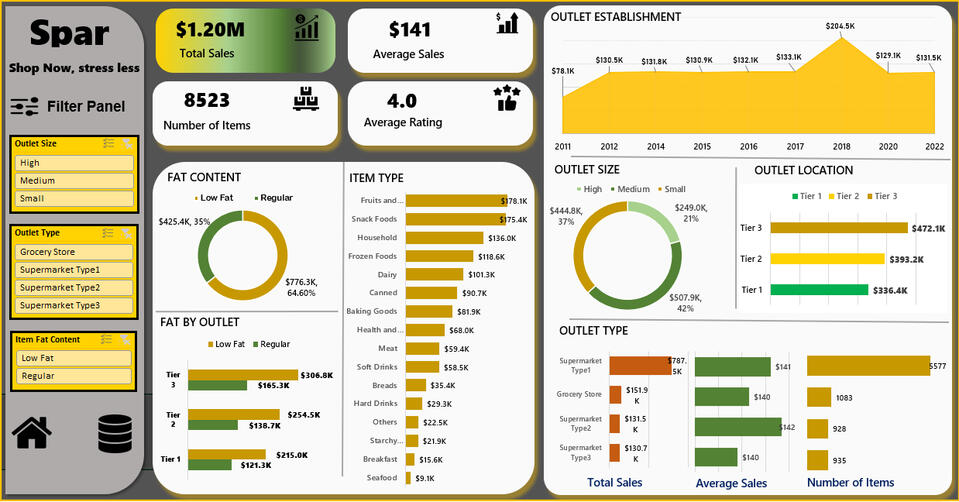
Key Takeaways from SPAR Excel Dashboard
Built using Excel with Pivot Tables & SlicersOverall Performance
Total Sales: $1.20M | Avg Sales: $141
Total Items Sold: 8,523 | Avg Rating: 4.0
Top-Selling Categories
Best: Fruits & Vegetables ($178.1K), Snack Foods ($175.4K)
Lowest: Seafood ($9.1K), Breakfast ($15K)
Outlet Insights
Outlet Size: Large outlets lead sales ($507.9K, 42%)
Outlet Type: Supermarket Type1 dominates ($787.5K)
Location: Tier 3 generates highest revenue ($472.1K)
Product Fat Content
Regular products: 64.6% of sales ($776.3K)
Tier 3 outlets lead in both low-fat ($165.3K) & regular sales ($306.8K)
Recommendations
Expand top categories (Fruits, Snacks, Household)
Boost sales in weaker categories & locations
Optimize small outlets & grocery stores